Software Metrics Power Ranking
There are a host of metrics that are supposed to help software teams understand what they’re good at, and what needs attention. But, the question is:
Which metrics are the right ones?
Answering this means having an opinion about what makes a metric useful (or useless). Well, we have just those opinions. More specifically, we have a rubric when evaluating a software metric. To be useful, a metric should be:
DISCOVERABLE
The metric shouldn’t require hours of work and/or an army of people to build macros and comb spreadsheets. If it does, it’ll collapse under its own weight.
ACTIONABLE
The metric should make obvious what needs attention. If a metric starts any kind of debate about what it means and what to do next, it flunks.
MEANINGFUL
We want things that actually move the needle, that show not only to ourselves but to the broader business how things are going.
Discoverable. Actionable. Meaningful. This rubric—call it the DAM scorecard—reveals that even some of the more well-known metrics are limited in a key area, which hurts their ranking. In our power rankings below, we use a scale from 1 (least) to 3 (most) to evaluate how each metric scores for discoverability, actionability, and meaningfulness.
Software Metrics Ranking
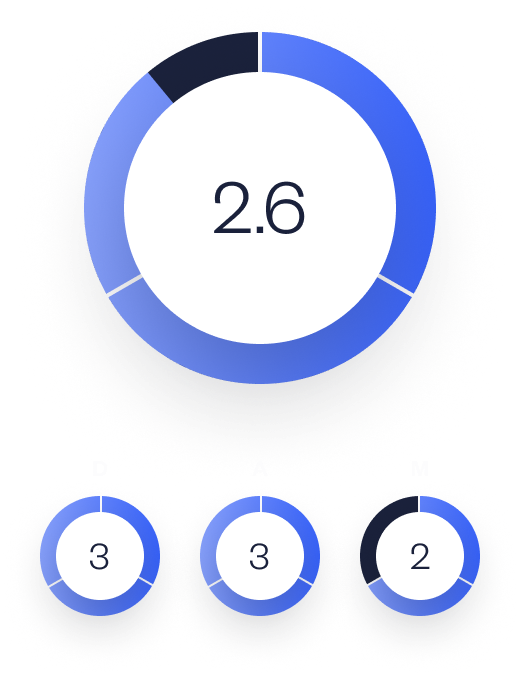
Flow Load
Depicts the amount of active work underway.
ANALYSIS
Flow Load recognizes a central truth: the more work on everyone’s plates, the less you actually get done. By showing the volume of active work, teams can use WIP (work in progress) limits to keep the amount of active work reasonable. However, the usual method for showing Flow Load—a Cumulative Flow Diagram (CFD)—is...

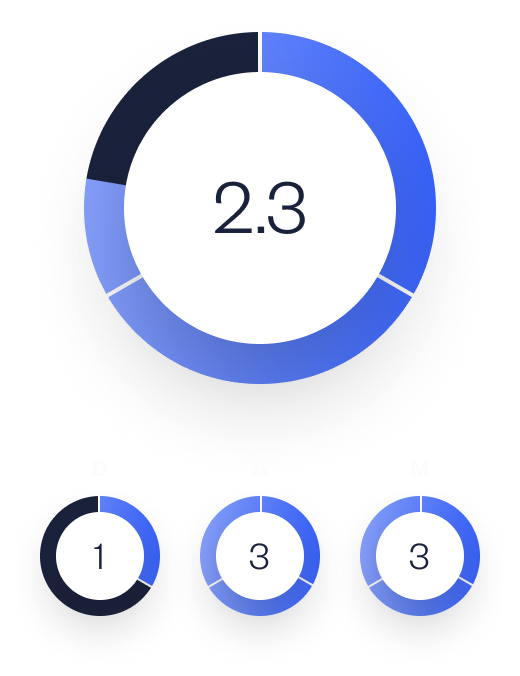
Throughput
Work delivered for a given period of time.
ANALYSIS
Two key points with this one. First, knowing how much work you delivered in a given period, by itself, is fairly meaningless. Is ten good? A hundred? A thousand? What we're really interested in is the number of tasks we completed, relative to the number of new tasks raised. Ten tasks completed is actually a good number, if the...
Flow Efficiency
Reflects how well work moves from start to finish by measuring the amount of time spent in any stalled, interrupted, or blocked state.
Cycle Time
In the words of Lean, cycle time is the “amount of time needed to deliver value.” Put even more plainly, this is speed: how long does it take to deliver work, from start to finish?
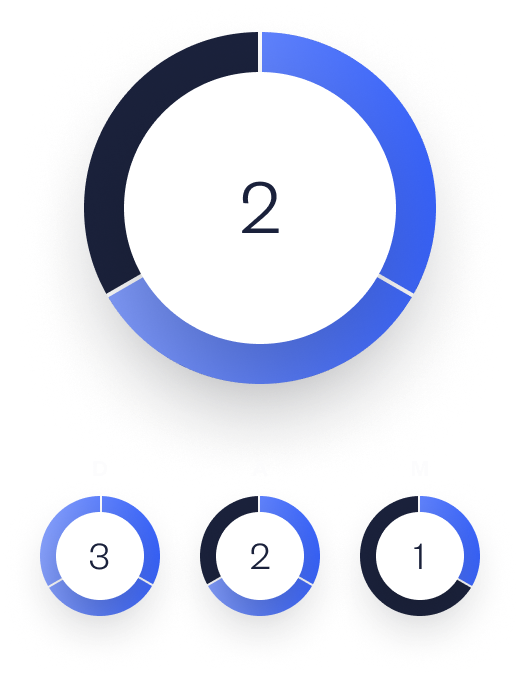
Deployment Frequency
How often new code changes are released into production.
ANALYSIS
For reliability and stability, regular, incremental changes are much better than intermittent, large changes. Deployment Frequency shows you how close you are to your ideal rate. Is it a metric broader stakeholders care much about? Maybe not. But that doesn't diminish its value as a diagnostic for things those stakeholders...

Flow Distribution
Shows the amount of each type of work delivered, over time.
ANALYSIS
Certainly it's useful to know, for example, that defects are steadily eating into feature work, or that work on technical debt has been falling steadily. The question, as with any metric: Is the juice worth the squeeze? That is, does the time spent surfacing and reviewing the data result in meaningful change?

Change Failure Rate
The percentage of deployments that result in failure, used to measure the reliability of an organization's change and release management practices.
Flow Predictability
How well teams deliver against objectives. Also referred to as say:do ratio.
ANALYSIS
The idea of Flow Predictability is sound. Knowing how reliably the organization hits its targets helps planners plan more realistically. But the work of manually analyzing commitments versus delivery, plotting that ratio over time, and using the results to inform future planning isn’t realistically sustainable. Moreover,...