CHANGELOG
Timeline view + expanded git metrics

Brad Hipps
4-5-2024
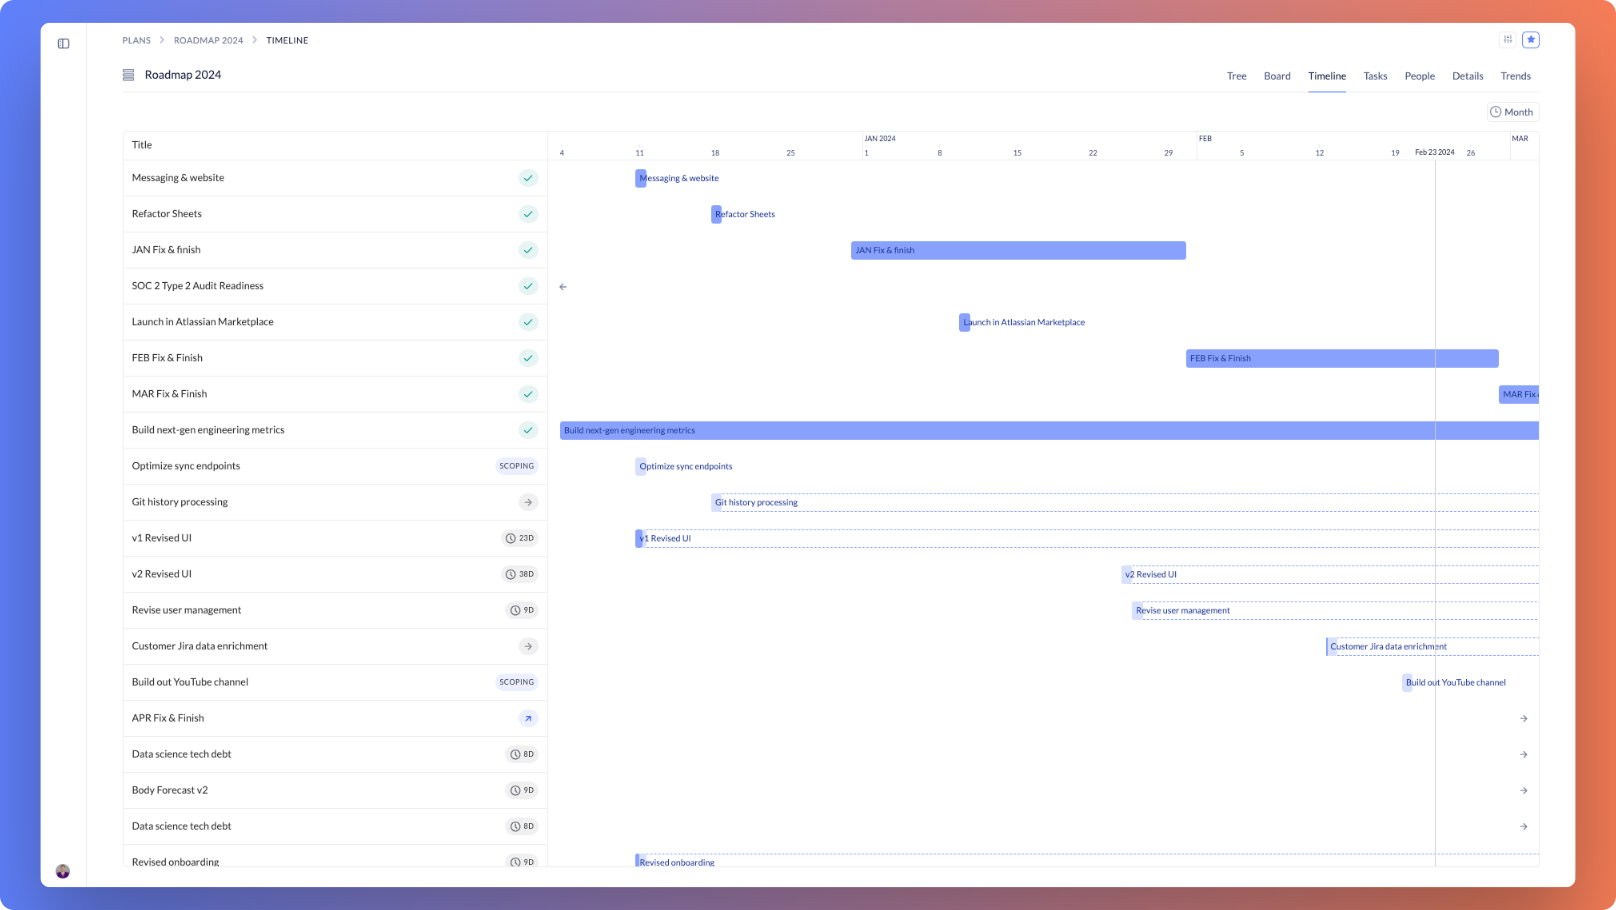
Timeline view for plans
In addition to tree and board modes, Plans now offer a timeline mode. With the timeline, you can see objective progress and forecast in a Gantt-style chart. The bar for each objective depicts start and end date (when set), as well as work progress. The darkest color is completed work; the lighter color is work in an active state. The dotted bar extension reflects Socratic's intelligent forecast for when the objective is likely to complete.
Expanded git metrics
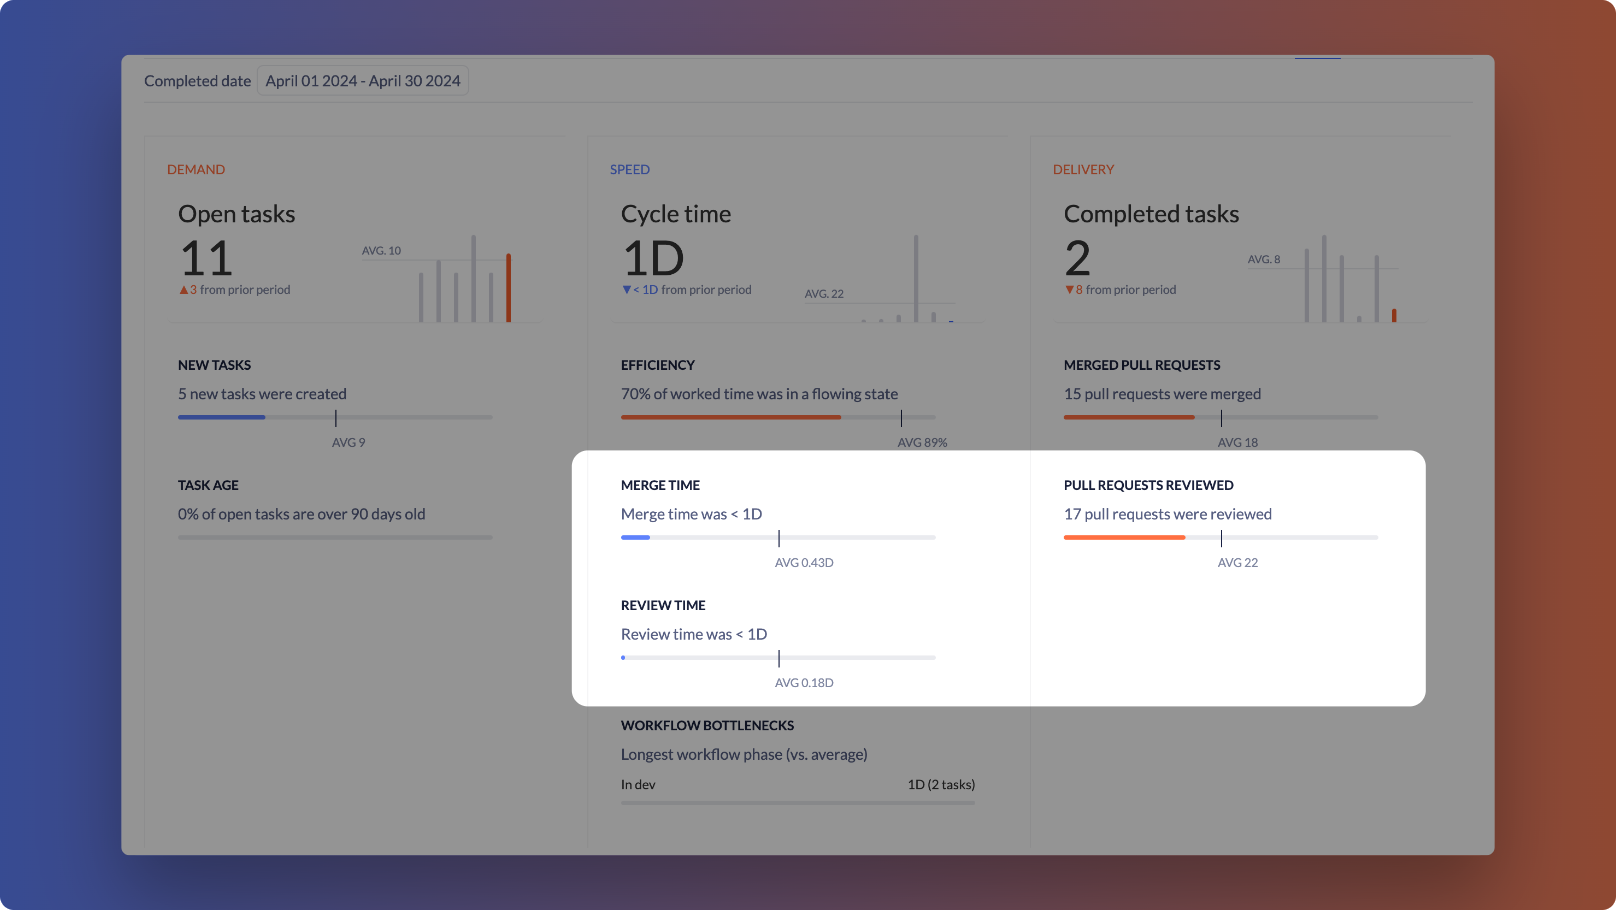
To understand coding trends over time, we've expanded the git portion of Trends to also show:
The average time to review pull requests, trended over time;
The number of pull requests reviewed, trended over time (person view only).
Fixes & enhancements
Optimized filter behaviors on plans with sub-objectives.
Fixed a bug preventing creation of new objectives from the plan board mode.
Corrected mismatched colors on plan filter icons.
Fixed display of extreeeeemely high decimal precision for merge times on Trends.