SMART PRACTICES
The data on faster delivery

What are the traits of fast, productive software engineering teams? We used data to establish some preliminary baselines and findings.
The data that follow are derived from anonymized work activity of hundreds of Socratic beta users across more than 10,000 tasks. This represents almost two full years of data, from January 2021 through September 2022.
How long does delivery take?
What’s our average speed to release work? Are we getting faster or slower? Where are the bottlenecks? All of these are first questions for many software teams. Here’s what we found…
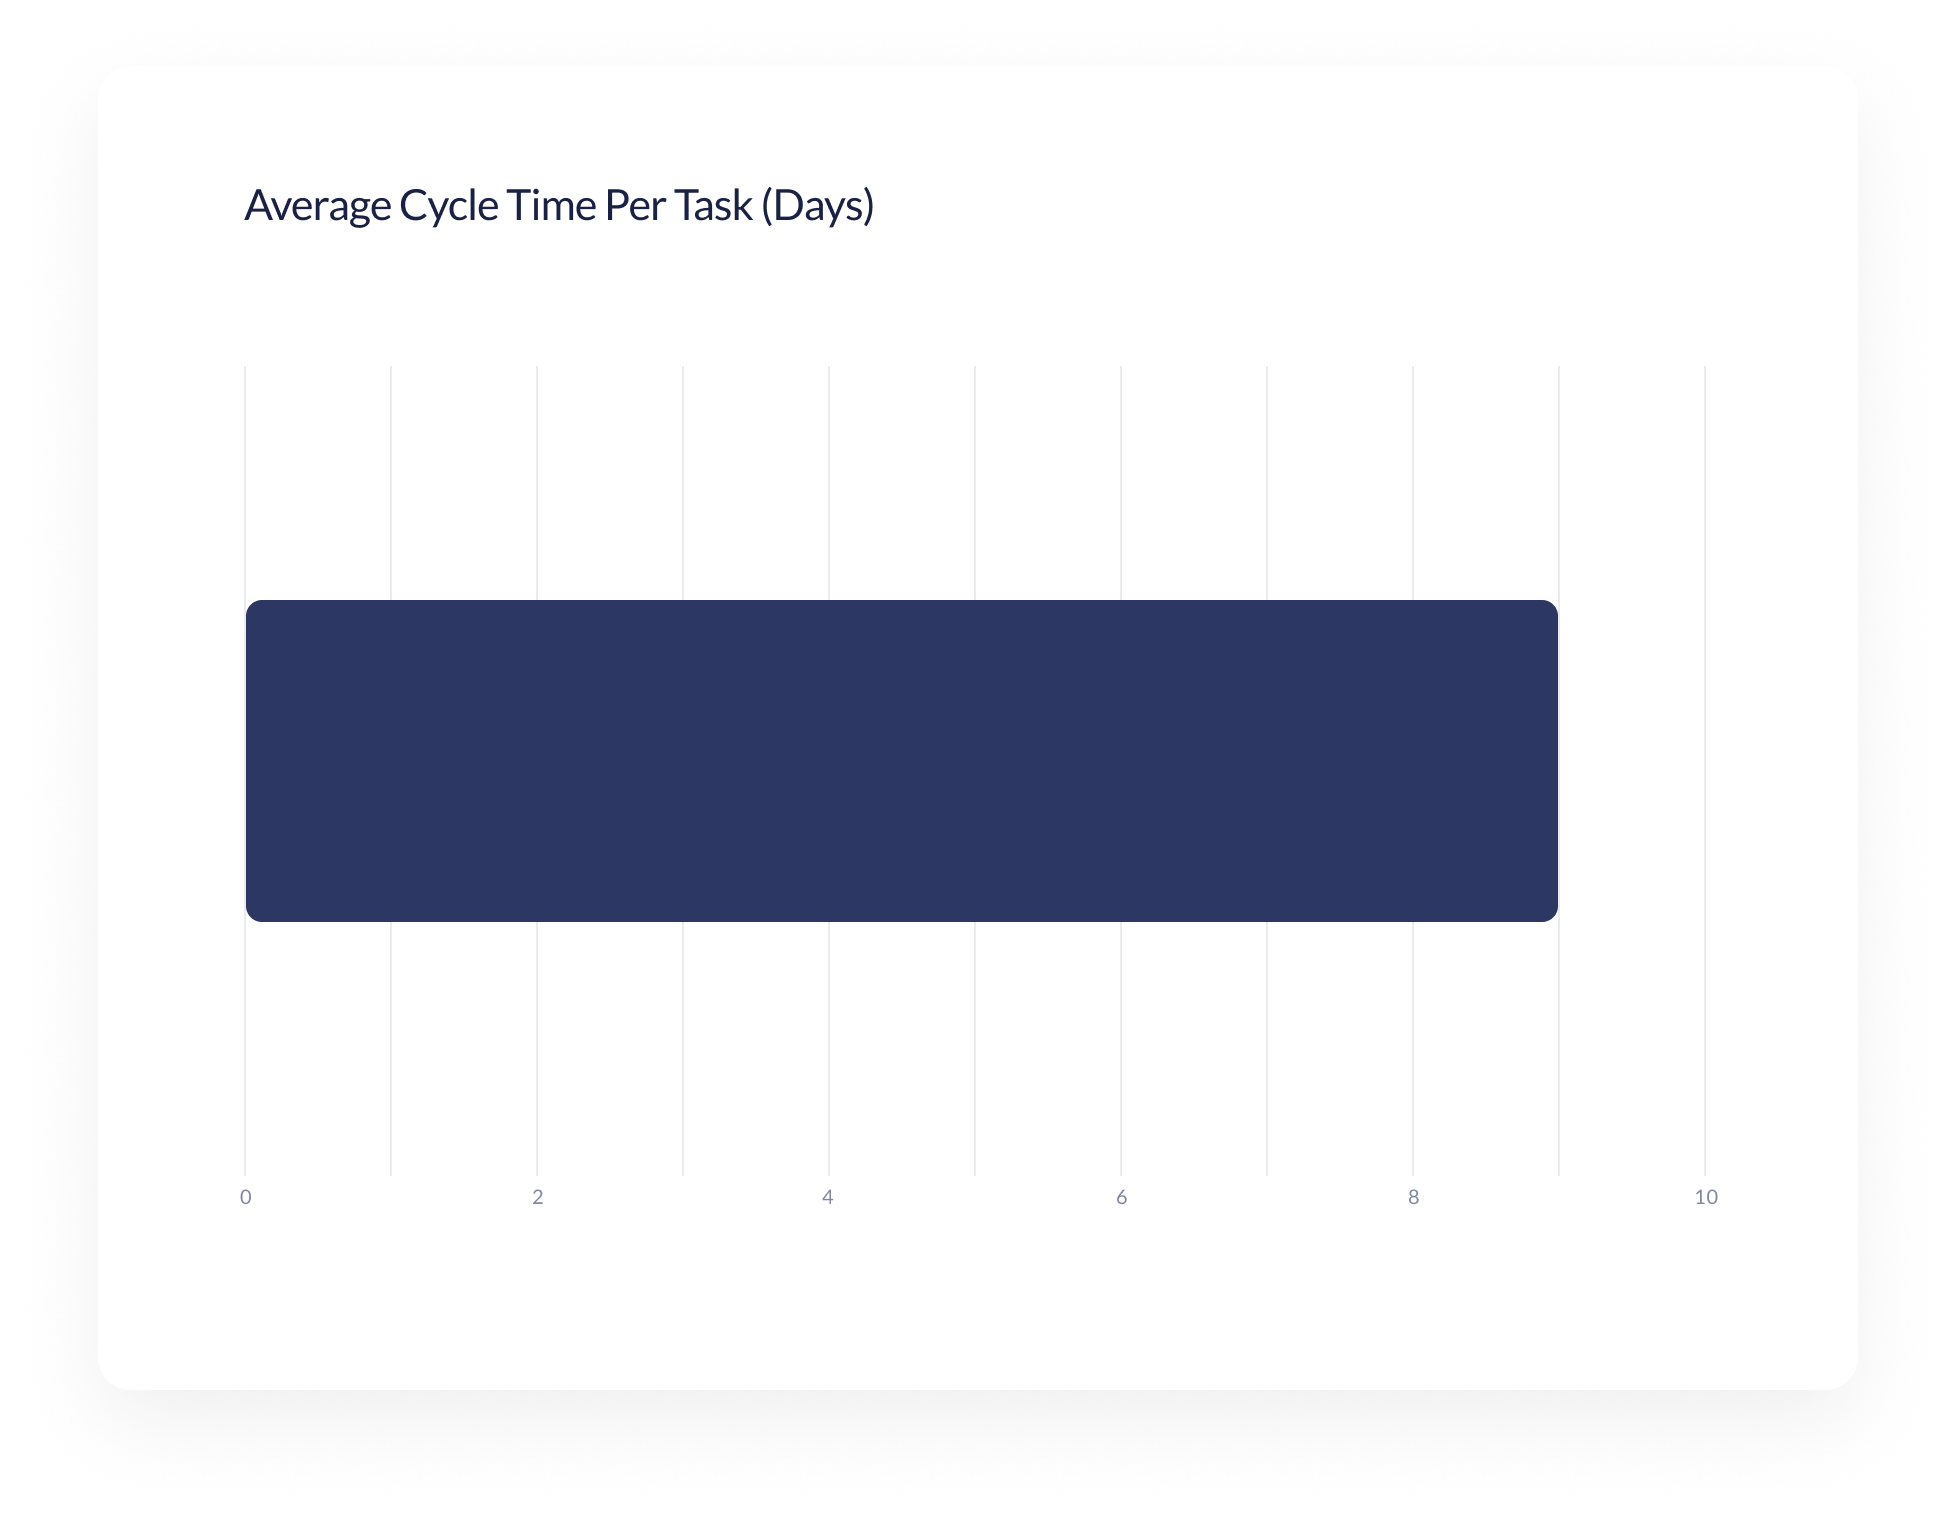
Average cycle time is 9 days.
A quick word on how we determine cycle time (speed). Socratic automatically measures the elapsed calendar days from the time work starts on a task, to the time it’s completed. So, if work begins on a Monday and finishes the following Monday, the total elapsed time for that task is 7 days.
During private beta, we saw the average task cycle time was 9 days.

In analyzing the elements of cycle time, some ways to improve stand out...
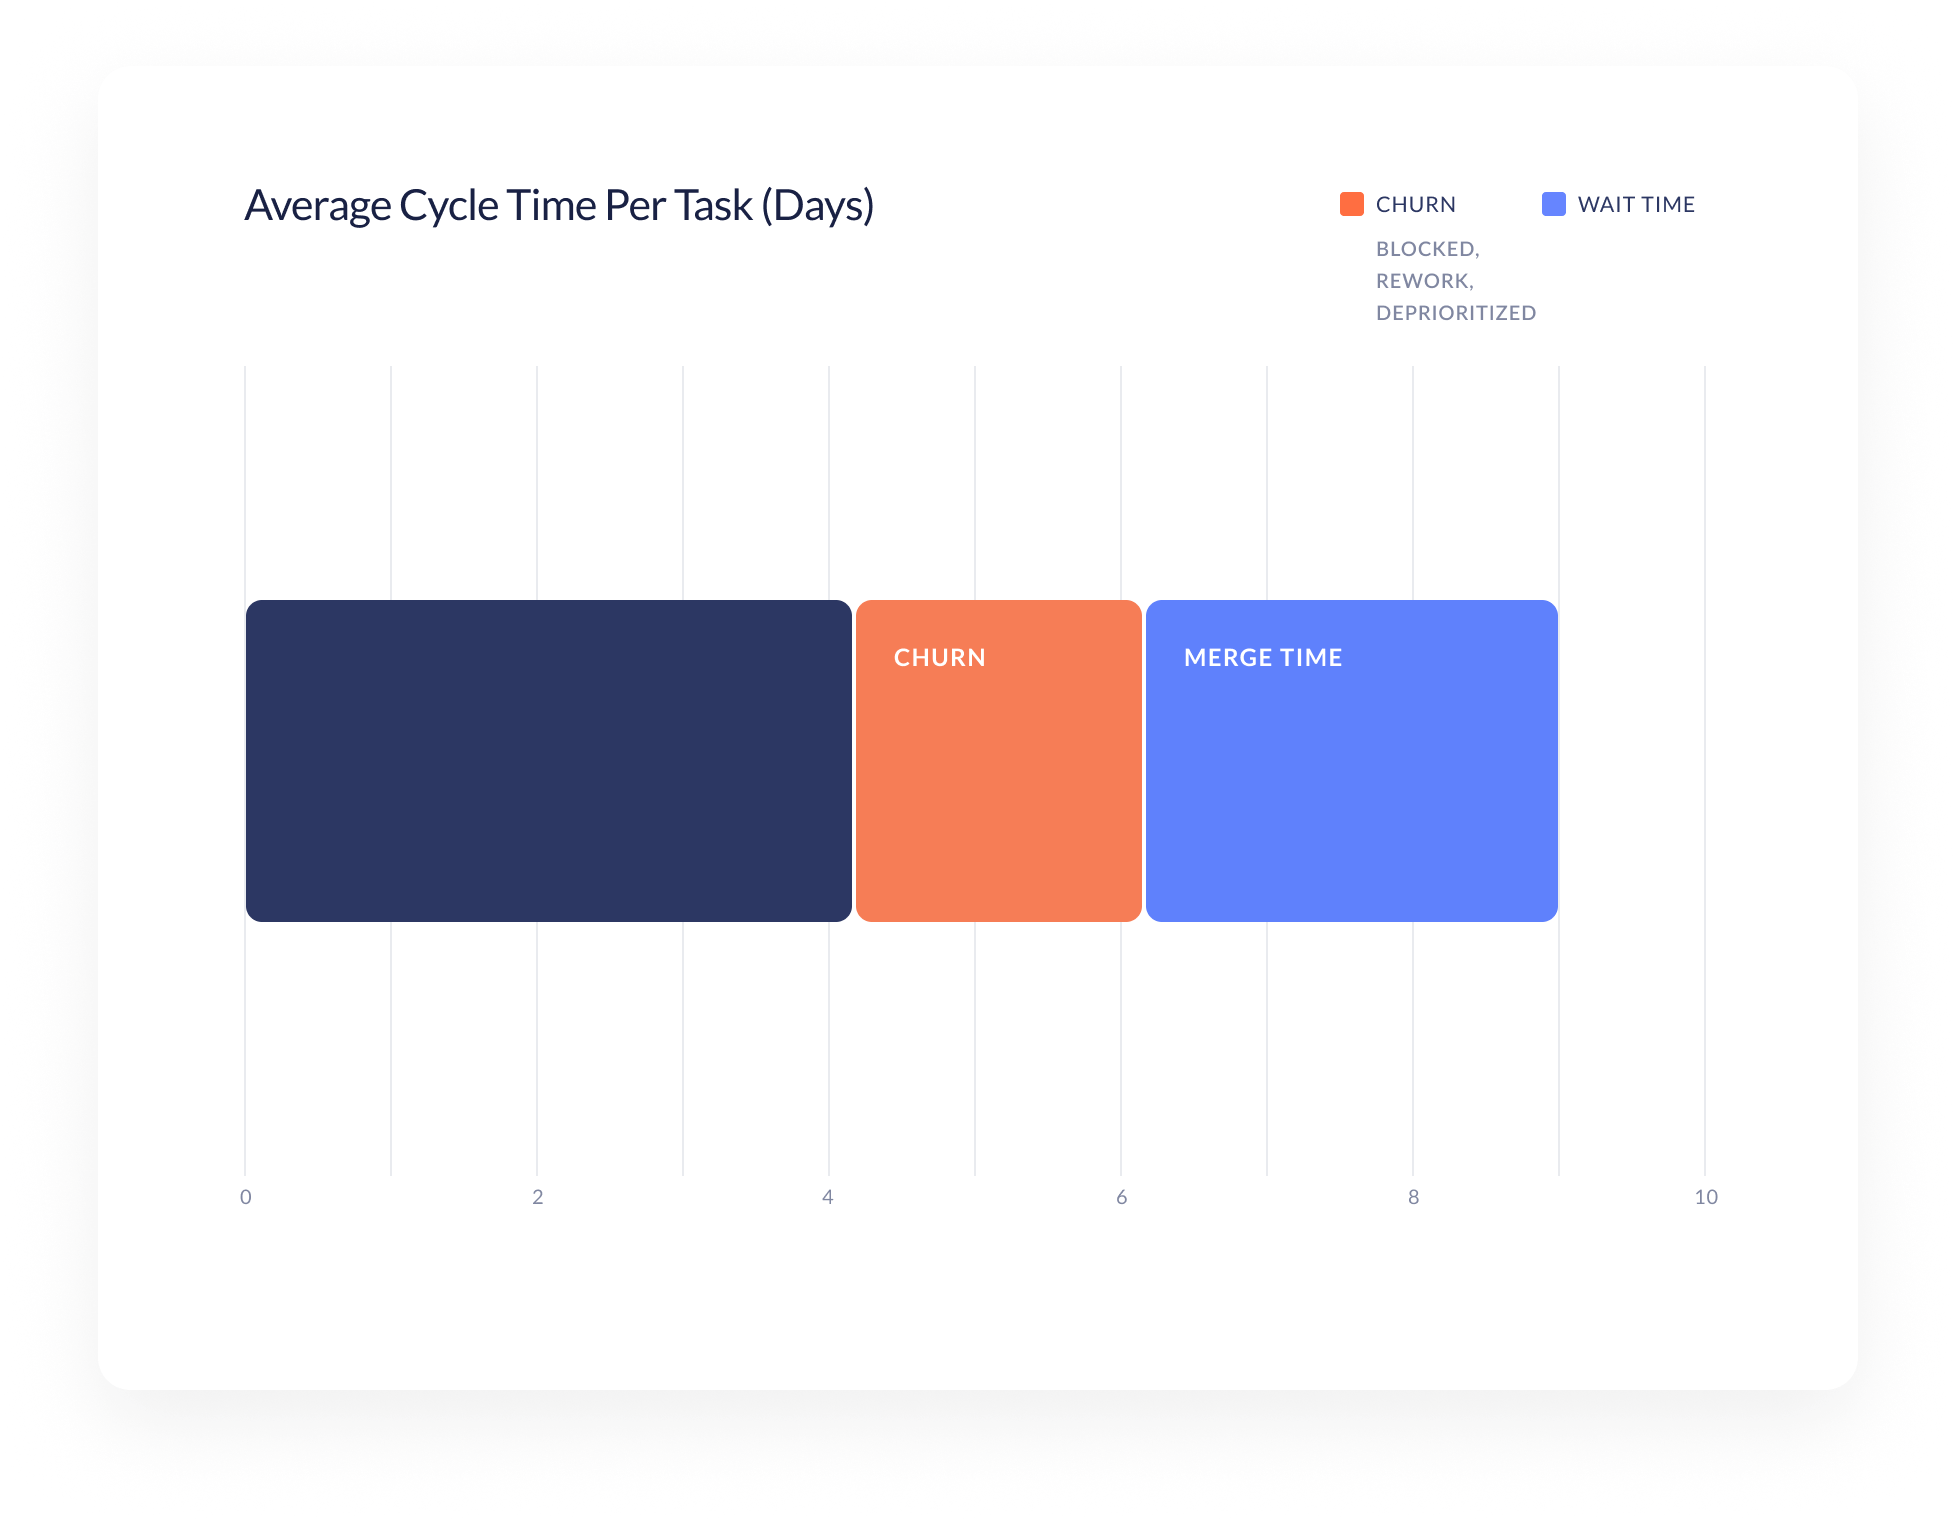
Merge time is the largest chunk.
The average time to merge pull requests was 2.9 days. With an average cycle time of 9 days per task, that means almost a third in wait time for tasks with code.

But merge time isn’t the only holdup.
Tasks averaged 19.6 percent of their duration in other, non-flowing exception states such as blocked, rework, or deprioritized. This means more than half (51.9%) of the average task cycle time is spent in waiting or exception states.
To clarify how we surface this: Socratic measures flow efficiency by comparing the amount of time that work spends in a good, flowing state—that is, moving from start to finish as smoothly as possible—relative to time spent in these common exception states: deprioritized, rework, blocked, or idle.
For example, if a task takes 5 days to move from start to finish, but along the way is blocked for one day, its flow efficiency is 80 percent. Four of its five days (80%) were in a normal, flowing state, with one day (20%) in a blocked state. (Our method is described in more detail here.)

What other factors contribute to speed?
With a baseline for speed, we were curious to search for correlations to faster delivery. Some of what we found surprised us…
Team size doesn’t matter for speed...
Even after removing outliers and setting minimums for the amount of work completed, there was little observable correlation between team size and the speed at which work was completed.

...but backlog size does.
Software teams with smaller backlogs (30 tasks or fewer) worked significantly faster than teams with larger backlogs. Those teams completed tasks in almost half the time, with notably higher efficiency (that is, less time in exception states).

The real driver of speed is workload.
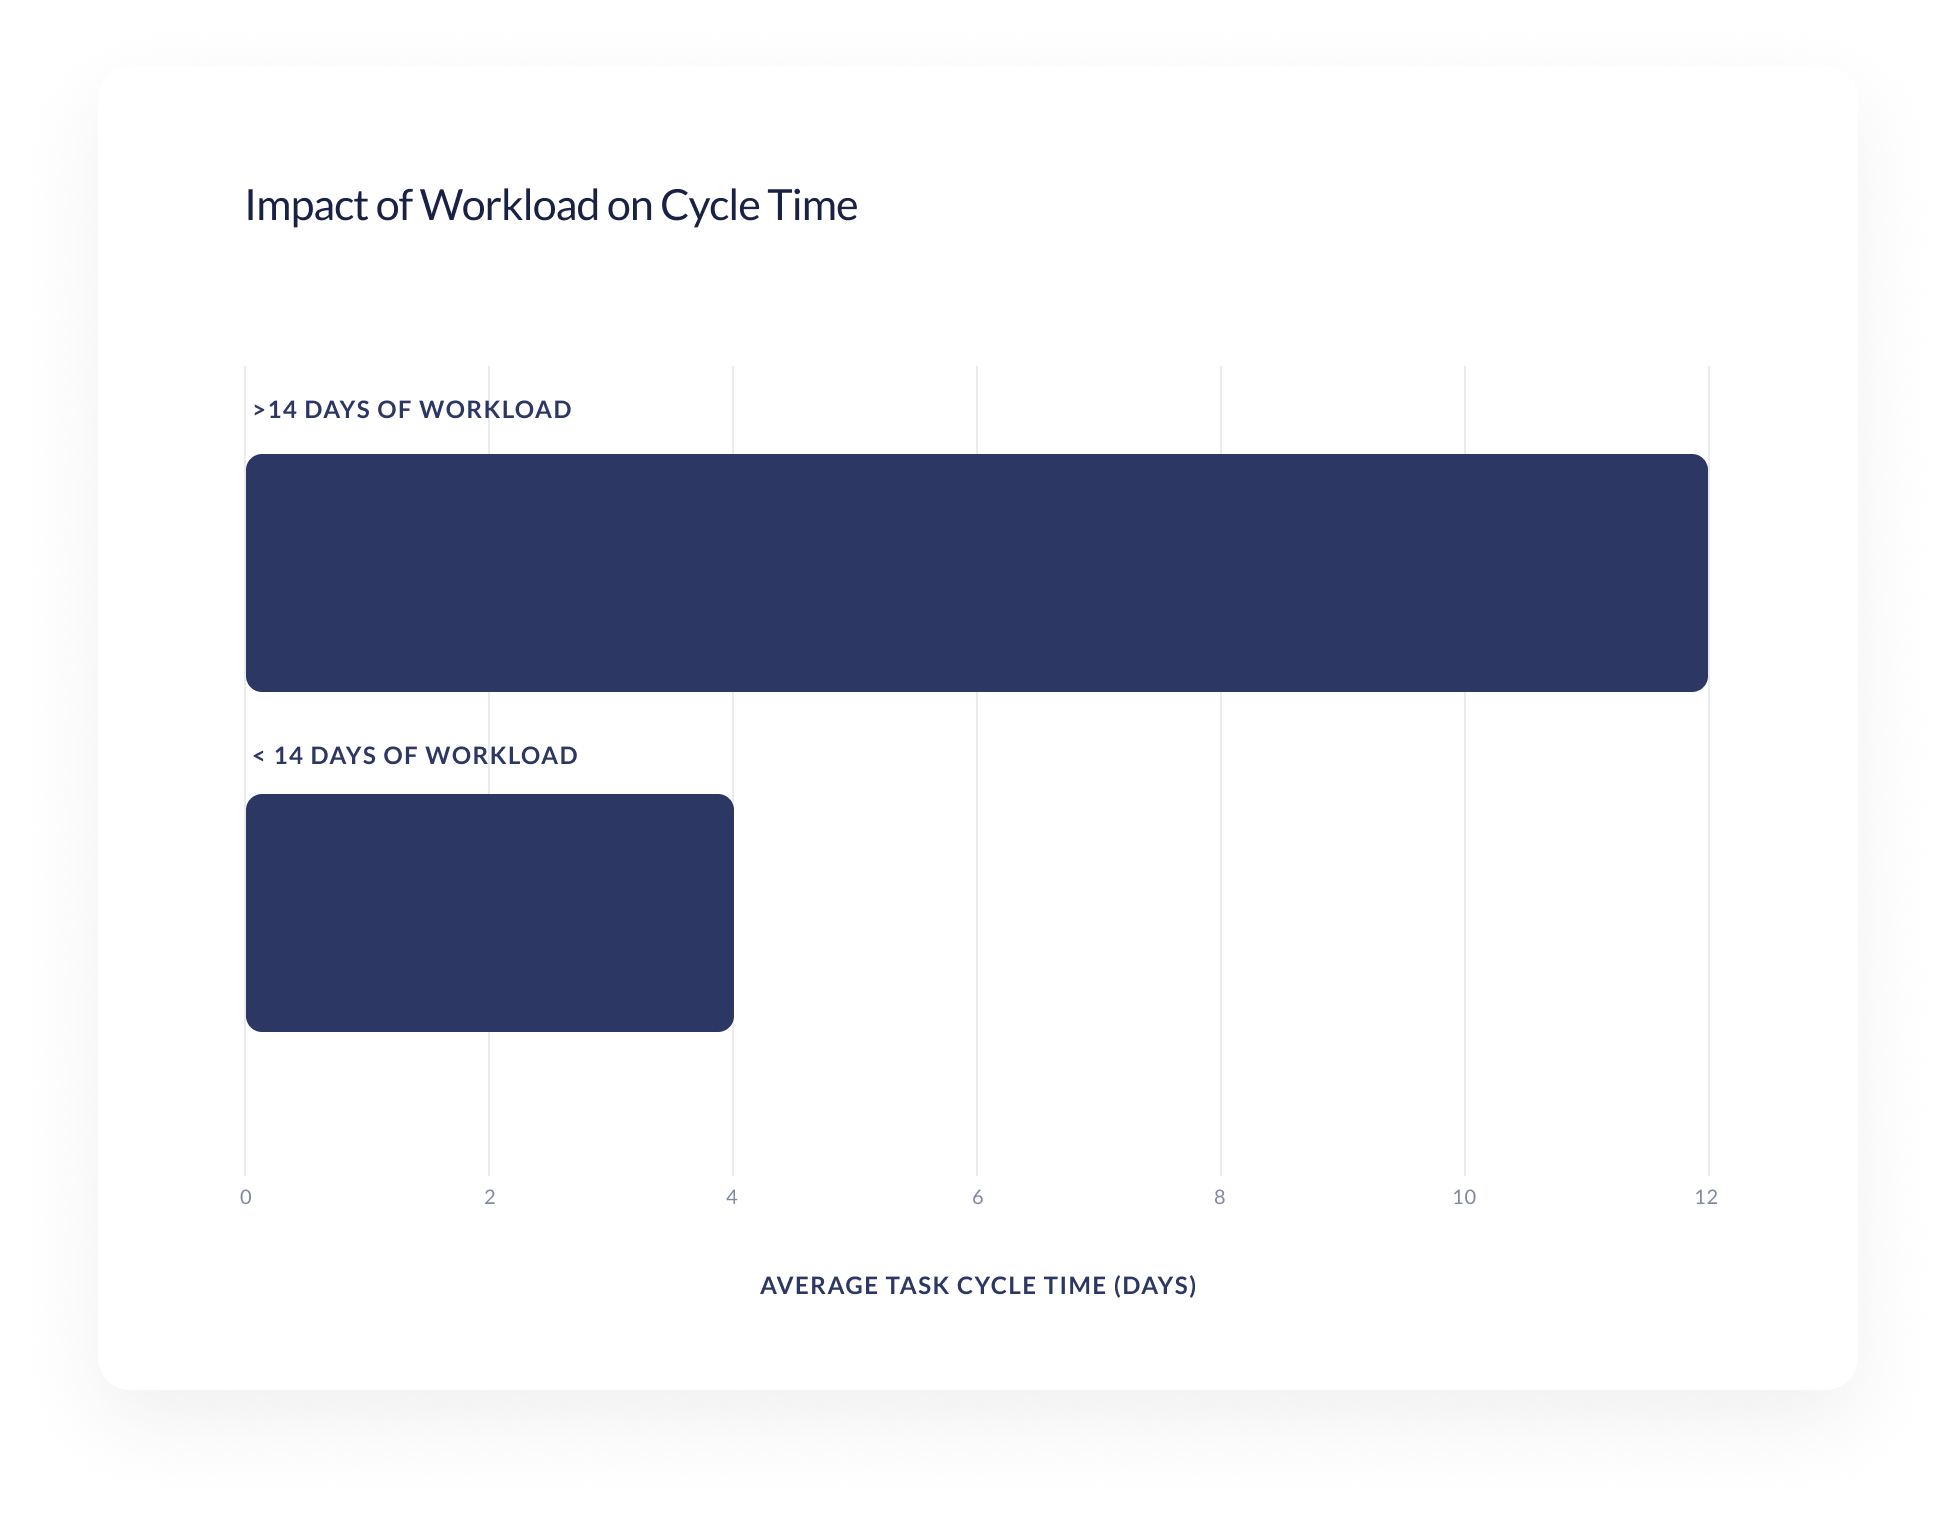
Limiting individual workloads had a significantly positive impact on cycle time. On average, a person with fewer than 14 days of work assigned to them completed their work three times faster (3x) than people with more than 14 days of work assigned.

Again, a word on what’s behind the data here. In place of estimates, Socratic uses historical actuals coupled with machine learning. To surface workload, we look at every contributor’s personal assigned work effort (in days).
The takeaways
✅ Cap the backlog.
Aim for 30 or fewer tasks in backlog. If need be, pick an age (e.g. 45 days) after which tasks are archived. Task that are important enough will come back around to earn priority.
✅ Attack wait time.
Want to speed work? Wait time is low hanging fruit. To reduce merge time, try breaking pull requests into smaller units. Less time to review will also mean less reluctance to review.
✅ Know your cycle time.
How long does it take to complete work? Where are the bottlenecks? Knowing your cycle time and its components gives a benchmark to operate from—and targets to improve.
✅ Set a limit on people’s workload.
Let people finish what’s on their plates before adding more work. Less context switching, fewer frustrations over priority. Start with an individual limit of 14 days of active work at one time.
