CHANGELOG
Introducing: next-gen AI forecasting

Brad Hipps
12-15-2023

Introducing: next-gen AI forecasting
We’re pleased to announce the latest generation of our AI forecaster. This new model employs Monte Carlo simulation. Monte Carlo is a statistical technique used to model complex systems across a wide range of fields. The idea is to use the law of large numbers to predict how a complex system might behave.
What does this mean for Socratic’s software project forecasting? The basic steps and inputs are as follows:
(1) Set up N tasks with random (but representative) durations.
(2) Set up a pool of M people to complete the tasks.
(3) Assign the N tasks to the M people.
(4) Determine the completion dates for each task.
(5) Construct a burndown chart from these dates.
(6) Repeat steps 1-5 Q times.
You provide N and M; Socratic provides the rest. This includes randomly-sampled task durations based on your organization’s historical actuals, which is needed for the first step. We’ve set the number of model runs (Q) to 1,000. (The more you do, the more statistical significance you gain, but it also starts to absorb some serious compute cycles. In our own analysis, a thousand runs strikes a nice balance between system responsiveness and forecast reliability.)
Simply put, this model reveals all of the possible durations if the same body of work was delivered by the same people, a thousand times. This range of outcomes is reflected by a date range rather than a single date.
With Monte Carlo simulation, we’re able to absorb complexities the previous, more deterministic algorithm can’t. These include nuances like:
The rate at which tasks fall idle;
The number and relationship of blocked tasks;
The amount of rework involved before a task is completed;
The amount of inevitable scope creep in a project;
The impact of holidays on people’s availability;
The participation of people with specialized skills.
This approach represents a significant leap from the previous model. As opposed to a deterministic algorithm, this next generation operates as a sort of semi-supervised one. Here the algorithm combines our domain knowledge of how work gets done with observations of real outcomes.
Measure productivity trends by task or objective
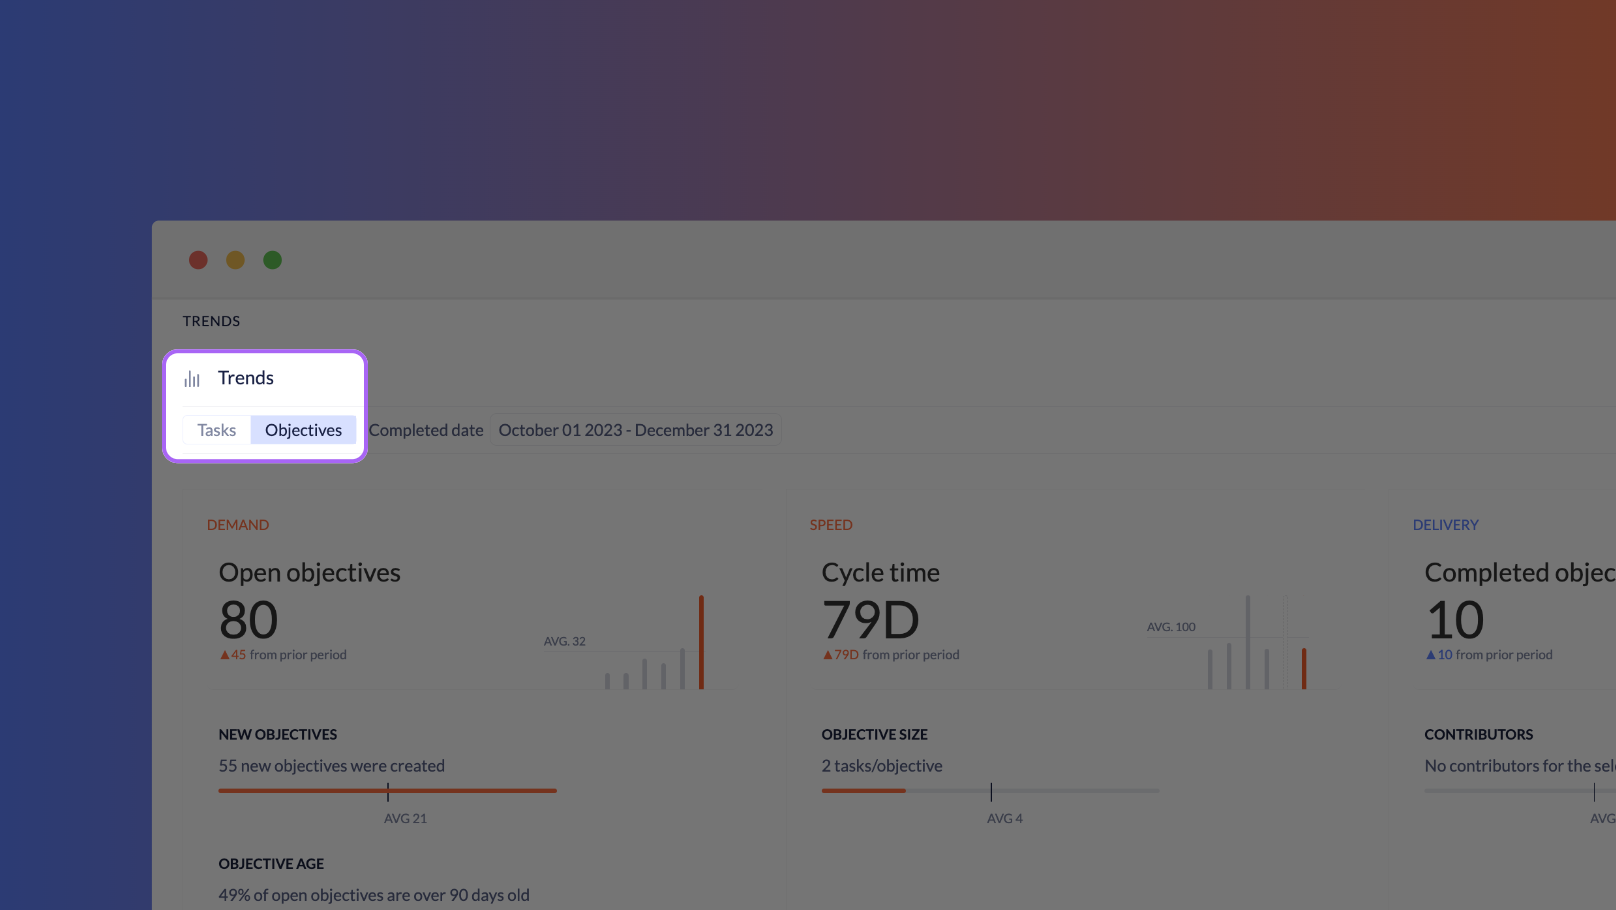
Socratic Trends now surfaces productivity data for both tasks and objectives. This means you can change your unit of measure to see, for example, the average cycle time for your objectives, for any period you choose. Just click the Tasks / Objectives buttons located in the top left of the Trends page.
Fixes & enhancements
Export Plans to .pdf. You can now export any plan to a .pdf for sharing with other stakeholders. In the Tree mode for plans, find the export button at the bottom right of the table.
See objectives by team. For each team you create, we now provide an Objective tab to show any objectives the members of that team are contributing work towards.
Rationalized & optimized progress and momentum colors.
Restored custom colors for labels.
Fixed a bug in which global search would display a 0 instead of listing recently searched tasks.
Fixed a bug that would sometimes cause the Notifications badge to show an incorrect count.
Fixed a bug preventing the ability to turn off sprints for a given workstream.